Sand Sieve Analysis of Biosand Filter Media Will Help Ensure Optimum Biosand Filter Effectiveness
Sand Sieve Analysis Introduction
The biosand filter requires a certain range of sand grain sizes to effectively treat drinking water.
Note: The content on this page has been adapted from publications of the Center for Affordable Water and Sanitation Technology (CAWST).
As mentioned in “Sand Media Prep”, crushed rock sand grains, when packed together, fit like puzzle pieces.
Their varied sizes and jagged edges produce tiny pores small enough to filter out pathogens found in water.
Please remember that the “sand” in a biosand filter:
1. originates as crushed rock,
2. is angular in structure, and
3. has grains of various sizes.
Any sand filter media that does not meet these parameters will not work effectively in a biosand filter.
The Center for Affordable Water and Sanitation Technology (CAWST) has conducted much research on biosand filters and, among other things, has determined that there is an optimum distribution of sand grain sizes that make a biosand filter the most effective.
Some sand grains are small and others are larger, and there is a range of sizes that are desirable for making a filter that works best.
It is possible and advisable to conduct a sand sieve analysis of the sand media that is to be used in a biosand filter.
This sand sieve analysis, although a bit technical and meticulous, will provide information needed to determine grain size distribution of the sand to be used in a filter and its potential for providing optimum filter effectiveness.
Before studying the information below, it is advisable to print out the sand sieve analysis blank form and the sand sieve analysis example form PDF files below.
This will give you valuable visual information that will be helpful in understanding the sand sieve analysis process.
Purposes of a Sand Sieve Analysis
The information from a sand sieve analysis has various uses.
It can be used to:
1. Determine if the prepared sand (sand that has been initially sieved and washed) that is to be installed in a biosand filter is within the Effective Size (ES) and Uniformity Coefficient (UC) ranges recommended for the filtration sand in the biosand filter.
Prepared Sand – This is sand that has been initially sifted to eliminate the largest rock pieces (grains that will not pass through a #24 sieve) and washed to remove the smallest sand particles that will pass through the #150 sieve.
Effective Size (ES) – This is defined as the size of screen opening that will pass 10% of the sand sample (see more explanation below)
Uniformity Coefficient (UC) – This is defined as a ratio and is calculated as the size opening that will just pass 60% of the sand (d60 value) divided by the size opening that will just pass 10% of the sand sample (d10 value).
ES is basically a value describing the average size of sand grains in a sand sample.
UC is basically a value describing the range of grain sizes present in a sample
2. Determine what useable sand will be produced from a sand source (e.g. a rock quarry or road cut) and how much sand will be rejected as too fine or too coarse.
Not all rock or sand from a crushed rock source will be used in the biosand filter. Some grains that are too large or two small will be rejected.
The sand sieve analysis can be used to determine how much sand will be rejected from a particular rock source.
The sand that is larger than the top sieve (0.7 mm opening size) is too coarse for filtration sand and needs to be removed (though this size may be used as aggregate in making concrete for the filter body).
Notes: If there is a large amount of coarse sand in the rock source, then the load that you will be transporting to the production site becomes unnecessarily heavy. There is no need to carry oversized sand if you cannot use it in the filters. The sand can be sieved at the quarry site to remove this coarse material before transporting it to your production site. This procedure is described in Instructions to Determine the Percent Rejected.
On the other hand, sand smaller than the finest sieve (0.1 mm opening size), which is collected in the catch pan at the bottom, is too fine for filtration sand. In that case, washing the sand in water will be required to remove this very fine sand (also known as rock flour).
If a sand sample that has been initially sieved and washed has too much of this very fine sand in it, then the sand to be used in the filter may need to be washed again to get rid of this rock dust.
3. Estimate if a sand source would be a good supply to produce filtration sand (once the sand had been prepared by sieving and washing).
This is done by determining the Effective Size (ES) and Uniformity Coefficient (UC) for the portion of the sand sample that would be useable.
This means performing the sand sieve analysis method described below, but only using the portion of sand that went through the largest sieve but did not go through the smallest sieve.
Most of the very fine sand that goes through the #150 sieve will be removed by washing, and so should not be included in the sample for this analysis.
Materials Required for a Sand Sieve Analysis
*Sand Sample: at least 100 ml of very dry sand for analysis that is representative of sand to be used in a filter
*Graduated cylinder: 100 ml size, with 1 ml markings, plastic is recommended
Note: experience has shown that it is preferable to use a graduated cylinder that has ml marks that begin at the bottom of the graduated cylinder.
Some graduated cylinders have marks that start at 10ml, so you cannot measure quantities of less than 10ml with such graduated cylinders.
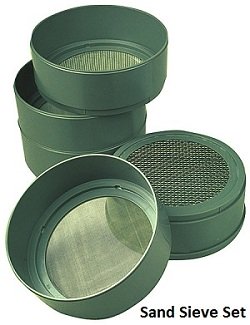
*Set of screens: A set of sand sieves that stack one upon the other with a catch pan on the bottom and a lid on the top (see photo).
Screens are stacked together in order with largest openings (#24) at the top and smallest openings (#150) at the bottom, with a lid on top and a catch pan at the bottom.
- #24 sieve (opening size = 0.71 mm)
- #40 sieve (opening size = 0.38 mm)
- #60 sieve (opening size = 0.25 mm)
- #80 sieve (opening size = 0.18 mm)
- #150 sieve (opening size = 0.10 mm)
- Catch pan (to catch all sand that passes #150 sieve)
- Sieve set lid (placed on top of the #24 sieve to contain the sand while shaking)
*Semi-log graph paper (provided in the PDF files on this web page)
*Pencil (If the graph paper is laminated, then you can use an erasable pen so that the markings can be erased and the graph can be reused many times.)
*Ruler
*Calculator
General Method of Performing a Sand Sieve Analysis
Sand sieve analysis is performed by shaking a sample of sand through a series of five screens with a catch pan at the bottom.
Each sieve size is smaller than the one before so that, after 5 minutes of shaking the sieve set, the sand will either be retained on top of the sieves or passed through the sieves.
The sieve sizes used in these instructions were specifically selected for analyzing sand for the biosand filter and the sand to be analyzed should be initially prepared.
This means that the sand should have already been sieved through a #24 screen to remove the coarse sand before taking the sample. The sand should also be well washed to remove the smallest particles that would pass through the #150 screen.
After measuring the amount of sand retained on each of the sieves, we calculate the percent of sand that passed through each sieve.
A point is marked on a semi-log graph for the Percent Passed Through the Sieve for each sieve size.
A line is then drawn on the graph connecting the five points. Using this line we can find the size of screen that would allow 10% of the sand to pass through.
This value is denoted as d10 and is called the Effective Size (ES) of the sand.
Further up this same line we can find the size of screen that 60% of the sand would pass through. This value is denoted as d60.
By dividing the d60 value by the d10 value we can determine the Uniformity Coefficient (UC = d60/d10) for that sand sample.
These two values, the Effective Size (ES) and Uniformity Coefficient (UC), are then compared to CAWST'S recommended ranges for filtration sand.
The instructions below describe this procedure in detail.
Notes: Using volume measurements rather than weight minimizes the equipment required while still providing adequate results for purposes of analyzing sand for biosand filters.
The sand sieve analysis is not an approved standard procedure but rather a workable field method for rapid assessment.
It is very important that the sand sample is totally dry before it is placed in the sieve set.
Wet or damp sand often plugs the screens making it difficult to sieve and the results will be incorrect.
Try to select the sand sample for sieve analysis so that it is representative of the sand you will be using.
Detailed Instructions for Performing Sand Sieve Analysis,
1. Stack the sand sieves with the coarsest (#24) on top followed by the #40, #60, #80, #150, and finally, the catch pan on the bottom.
2. Fill the graduated cylinder to the 100 ml mark with a sample of the dry prepared sand. Use a piece of paper, rolled or folded, as a "funnel" to make it easier to fill the graduated cylinder.
3. Pour the entire 100 ml sample from the graduated cylinder onto the top sieve (#24) and place the lid on top of the sieve.
4. Shake the entire sieve set, including the bottom catch pan and top lid, for at least 5 minutes. Shake both sideways and up and down to ensure the sand falls through the various screens.
5. After 5 minutes, remove the top lid and pour the sand from the #24 sieve into the graduated cylinder. Use a piece of paper as a funnel to help pour the sand into the cylinder.
Read the amount of sand in the graduated cylinder. Do not pour out the sand from the cylinder afterwards.
There should be very little sand caught in the #24 screen if the larger particles have been removed during preparation at the rock source.
In the table on the semi-log graph paper provided, record the value in the column labeled "Cumulative ml Sand Retained" for the #24 sieve.
Note: There should be very little or no sand on the #24 sieve since your sample should have already been sieved through the #24 sieve size to remove the coarse sand.
6. Remove the next #40 sieve and pour the sand from it into the cylinder(on top of the sand from the #24 sieve), then read the total amount of sand in the cylinder.
Record the value in the column labeled "Cumulative ml Sand Retained" for the #40 sieve.
7. Repeat Step 6 for the #60 sieve, then the #80 sieve, the #150 mesh, and finally the catch pan. Once all of these sieves (and catch pan) have been poured into the graduated cylinder, it should read approximately 100 ml.
Some sand may have been lost in the shaking and the total may not add up to exactly 100 ml. Try to avoid any sand loss by emptying the sieves thoroughly and lightly tapping the cylinder after each sieve to help settling.
8. Calculate the "Percent Retained" on the sieve and the "Percent Passing Through the Sieve" for each sieve and record your results.
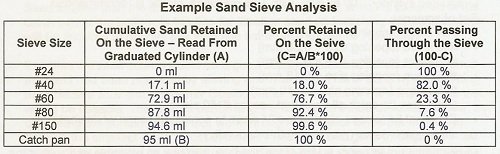
9. Plot the "Percent Passing Through the Sieve" value for each sieve size on the graph paper and then draw a line joining the 5 points as shown on the Example Worksheet.
(Line starts at #24 sieve size and ends at #150 sieve size)
10. Determine the Effective Size (ES).
This is defined as the screen size opening that will just pass 10% of the sand (d10 value). Read this value from the graph where the line crosses the "Passing Through the Sieve" line at 10%.
Recommended ES range = 0.15 mm to 0.20 mm (an ES within this range is likely to achieve 0.4 liters per minute flow rate in the biosand filter).
11. Determine the Uniformity Coefficient (UC).
This is defined as a ratio and calculated as the screen size opening that will just pass 60% of the sand (d60 value) divided by the screen size opening that will just pass 10% of the sand sample (the d10 value).
Recommended UC range = 1.5 to 2.5 (a UC within this range is likely to achieve 0.4 liters per minute flow rate in the biosand filter).
12. Determine the Percent Passing Through the #150 Sieve.
This is the measure of the very fine sand (also called rock flour) that can plug the filtration sand and cause turbid water to come out of the biosand filter.
CAWST recommends that the sand is washed sufficiently so that not more than 4% of the sand will pass through the #150 sieve.
(If you find that your sand sample contains more than 4% in the catch pan, you may have to wash and dry your sand sample again to remove rock dust that can cause clogging of a biosand filter).
Instructions to Determine Percent Rejected
To determine what percentage of a sand source will be too large to use as filtration sand:
1. Place only the #24 sieve on to the catch pan. Take a representative sample of your dry sand.
2. Fill the graduated cylinder with 100 ml of the dry sand sample.
3. Pour the entire 100 ml sample from the graduated cylinder onto #24 sieve and place the lid on top of the sieve.
4. Shake the #24 sieve, including the bottom catch pan and top lid, for about 20 seconds. Shake both sideways and up and down to ensure the sand falls through the screen.
Remove the top lid and pour the sand from the #24 sand sieve into the graduated cylinder. Use a piece of paper as a funnel to help pour the sand into the cylinder. Read the amount of sand in the graduated cylinder.
This value is the Percent Rejected as Too Coarse.
Remember, your initial preparation of the rock source material should get rid of most, if not all, of any material that would be caught in the #24 screen. You may want to sift your rock source a second time if the amount of sand that is too coarse would make the load to be transported unnecessarily heavy.
To determine what percentage of a sand source will be too fine to use as filtration sand:
1. Place only the #150 sieve on to the catch pan. Take a representative sample of your dry sand.
2. Fill the graduated cylinder with 100 ml of the dry sand sample.
3. Pour the entire 100 ml sample from the graduated cylinder onto #150 sieve and place the lid on top of the sieve.
4. Shake the #150 sieve, including the bottom catch pan and top lid, for about 20 seconds. Shake both sideways and up and down to ensure the sand falls through the screen.
Remove the top lid and pour the sand from the #150 sand sieve into the graduated cylinder. Use a piece of paper as a funnel to help pour the sand into the cylinder. Read the amount of sand in the graduated cylinder.
This is approximately the Percent Rejected as Too Fine for use in the biosand filter.
This extra fine material will need to be removed by washing sand again if the percent captured in the catch pan is more than 4%.
Instructions for Constructing Your Own Set of Sand Sieves
Return to "Introduction to Biosand Filters" from "Sand Sieve Analysis"
Return "Home"